 If you’re into fantasy sports, you pay a lot of attention to statistics. You pick players for your fantasy team based off of their past statistics, and you hope those players continue to put up good numbers so that your team does well. Now, there are no fantasy SAR leagues, but there are BSA programs, and your BSA team will do a lot better if you’re aware of past SAR stats. In this area, FinCEN has got you covered. It recently published its annual recap of suspicious activity report filing statistics. This report–the SAR Stats Technical Bulletin from FinCEN–is an excellent resource for learning what’s hot as well as what is emerging in suspicious activity reporting. Crowdfunding, prepaid fraud, email fraud, false statements, funnel accounts, and other activities were identified in the report as trending.
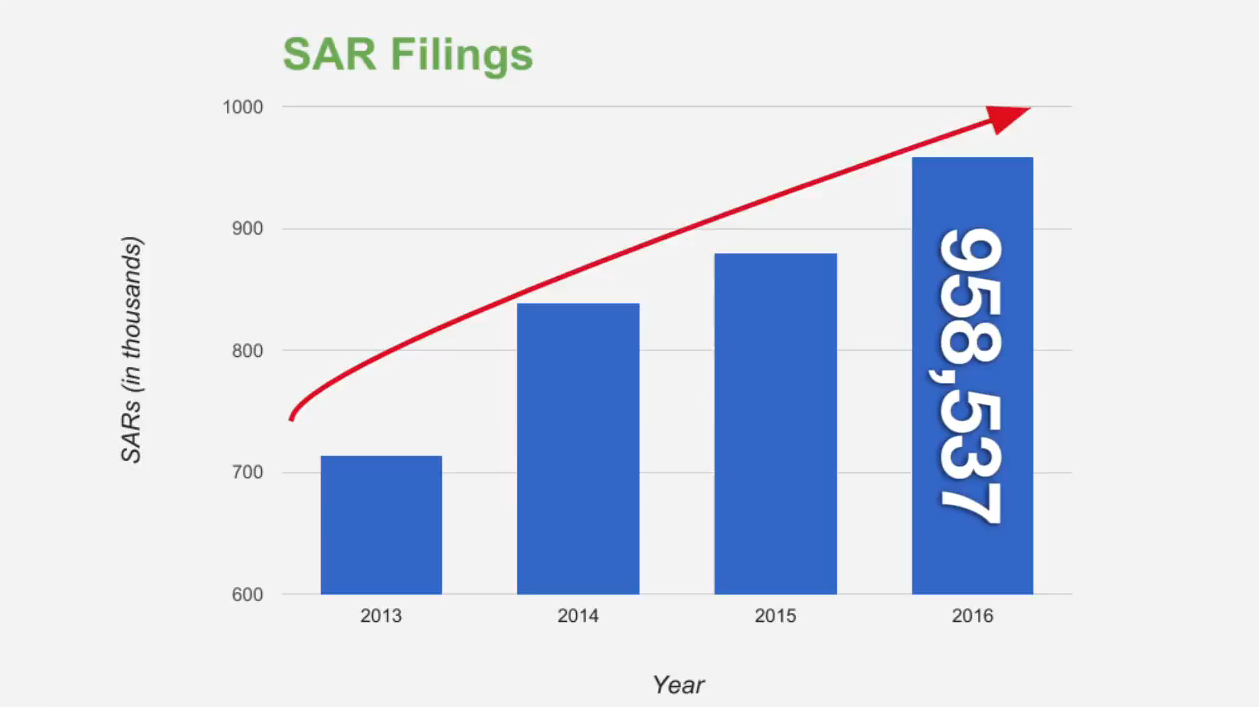
2016 saw more than 950,000 SARs filed by financial institutions, and a year-by-year look at these submissions shows that these numbers are trending up.
Those 950,000 SARs cover 79 different types of suspicious activity. The two most-reported types were “multiple transactions below CTR threshold” and “suspicion concerning the source of funds,” which combined to account for 20 percent of the suspicious activity reported.
Some other notable types of reported suspicious activity were “suspicious use of multiple locations,” “transaction out of pattern for customer,” and “transaction with no apparent economic, business, or lawful purpose.” Together, these made up another 18 percent of the reported activity.
The report also breaks these types into larger categories. For depository institutions, the three categories with the highest number of reported activity (besides “other”) were money laundering, fraud, and structuring. Delving further into money laundering concerns, the three most reported categories were “suspicion concerning the source of funds,” “transaction out of pattern with the customer,” and “suspicious EFT/wire transfers.”
Geographically speaking, the top three states where SARs are filed are California, New York, and Ohio. These three states combined to account for more than 30 percent of all SARs filed in 2016.
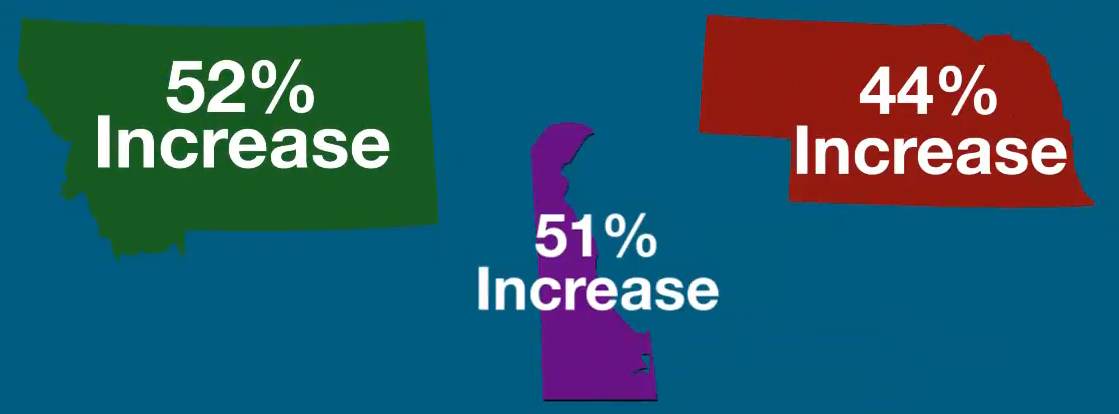
While the big states see the bulk of the SAR activity, the three states that saw the biggest increase in growth in SARs between 2015 & 2016 were Montana, Delaware, and Nebraska.
National banks file the most SARs by far. The report shows that banks whose primary regulator is the OCC file more than two-thirds of all SARs, at 68 percent.
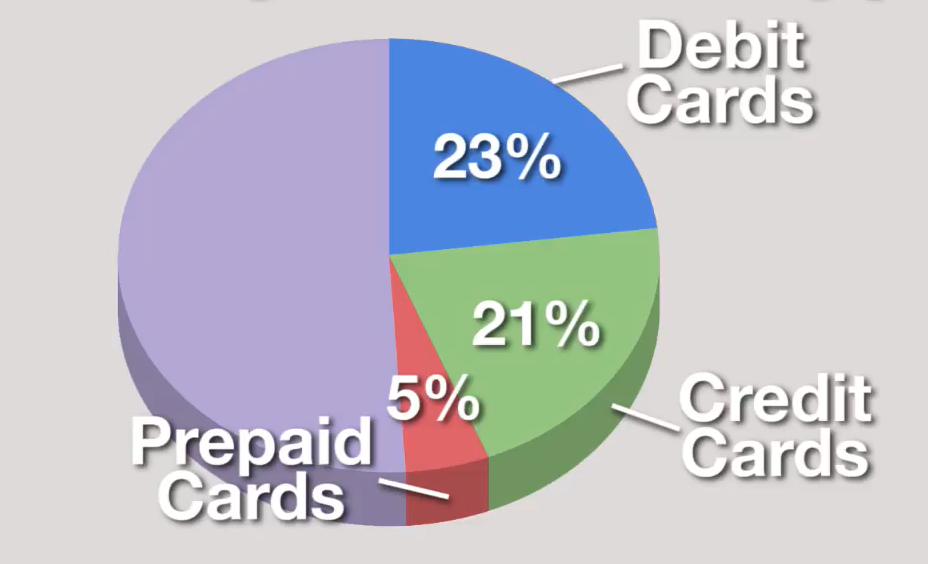
One final statistic worth noting is the number of SAR filings by product type. The three products that saw the most SARs were debit cards at 23 percent, credit cards at 21 percent, and prepaid access cards at five percent, which make up nearly half of all SARs by product type.
If you’re involved in your financial institution’s bank secrecy act program, spending some time reviewing FinCEN’s SAR Stats can be one of the most informative ways you can help keep your program current and effective.


